As predicted in 1967 by Manabe and Wetherald, the stratosphere has been cooling.
A new paper by Ben Santer and colleagues has appeared in PNAS where they extend their previous work on the detection and attribution of anthropogenic climate change to include the upper stratosphere, using observations from the Stratospheric Sounding Units (SSUs) (and their successors, the AMSU instruments) that have flown since 1979.
So SSU me
Like MSU trends, these records reflected a weighted average of atmospheric temperatures, and the three SSU channels progressively weight higher levels in the stratosphere, roughly centered on 30km, 40km and 45km above the surface but with quite a bit of overlap. Until relatively recently, there were some discrepancies in what the climate trends were from these instruments because of the usual issues with remote sensing – instrument trends, orbital shifts, inter-satellite calibration etc. Thompson et al. (2012) described the issues as ‘mysterious’, but efforts to better correct the record for non-climatic effects soon bore fruit, and the ‘mystery’ became history (Maycock et al., 2018). We are using the NOAA-STAR version 3.0 of these products (Zou et al., 2014).
Since then, these records have been used to assess the solar contributions to stratospheric temperatures and as a standard part of the GISS Model evaluation (most recently in Casas et al., 2023) and also in the “Climate Drivers” animation. The Santer et al contribution is the first time I’ve seen these diagnostics calculated for the CMIP6 models (or at least a subset of them), and so this is a great opportunity to add the SSU trends to our catalogue of model-observation comparisons that can be maintained going forward.
A couple of things to note before we get to that analysis though. First, the internal variability of the global mean values of these records is much smaller than for the tropospheric MSU trends, and that means that the (forced) signal to noise is much higher. The dominant factors are changes in CO2 (a cooling), ozone depletion (a cooling), warming from big volcanoes, and oscillations related to the solar cycle.
But why is the stratosphere increasingly chill?
For some reason, this has been poorly communicated among otherwise knowledgeable folk, and our early efforts to explain this were not very good (this featured in the only RealClimate post we ever basically retracted – though you can find it if you care to look!). Part of the confusion related to the role of the ozone layer in the lower stratosphere, but it turns out that is just a distraction, since the cooling due to increasing CO2 is seen everywhere above the tropopause – not just in regions with lots of ozone.
The basic concept is easy to grasp though. Concentrations of CO2 are increasing throughout the atmosphere and while we might think of greenhouse gases as absorbers of infra-red radiation from the surface, they are also emitters of IR radiation, so whether they warm or cool a region of the atmosphere is due to whether the net change (increased absorption vs increased emission) is positive or negative. The upper atmosphere is different from the troposphere in that pressure is much less, and it’s very dry. That means the greenhouse substances are basically just CO2 and ozone, and they absorb in quite different parts of the spectrum. In the band of radiation where CO2 absorbs a lot (~15 $\mu$m), increasing CO2 levels in the troposphere make it ever harder for those photons to get to the stratosphere or above. The upward IR comes increasingly from the water vapour or cloud bands, which because the upper atmosphere is so dry, does not get absorbed significantly on it’s way out.
Looking down from above, our extra stratospheric CO2 molecules then see less radiation to absorb coming up, but they are totally happy emitting more – half of which goes up into space. So the net effect is less absorption and more emittence, and thus they give a cooling. The effect is larger the further up you go.
How well do the models do?
As in previous comparisons, I’ll plot the envelope of the CMIP6 ensemble, in this case there are 32 individual runs from 9 distinct models. Unlike in the MSU or SST comparisons, there is no significant variation in the trends as a function of climate sensitivity, and so there is no need to plot the screened models separately. [This might be surprising, but remember that the variation in climate sensitivity is dominated by cloud feedbacks which are not very important in the stratosphere].
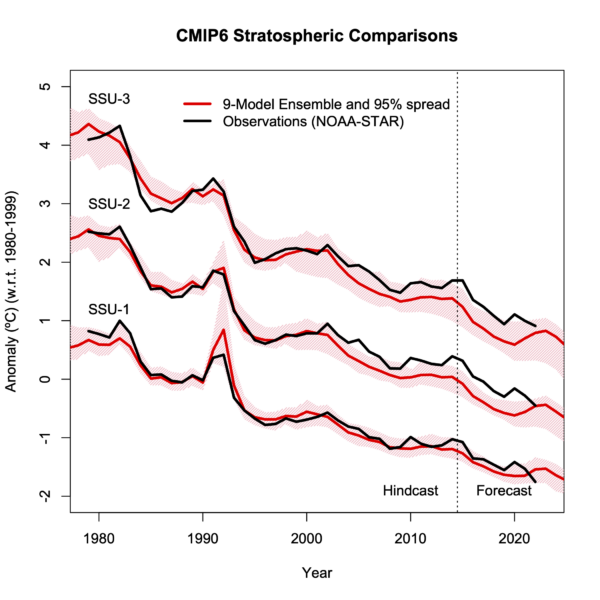
The two big warming events in the earlier part of the record are the impacts of the El Chichon and Mt Pinatubo eruptions (and you’ll note quite a wide spread in magnitude of the latter event) and if you squint, you can see the solar cycle (maxima around 1981, 1991, 2002, 2014). The trends are dominated by the CO2 changes (more so as you move higher), but there is also a component from ozone depletion. As mentioned above, the internal variability and structural uncertainty in the model ensemble is smaller than in the troposphere, and so mismatches between the models and the observations are likely due to small issues in the forcings (particularly ozone, but perhaps also small volcanoes). It’s possible that the quality of the stratospheric circulation and it’s sensitivity to warming may be important. However, the discrepancies in the trends are small.
References
- B.D. Santer, S. Po-Chedley, L. Zhao, C. Zou, Q. Fu, S. Solomon, D.W.J. Thompson, C. Mears, and K.E. Taylor, "Exceptional stratospheric contribution to human fingerprints on atmospheric temperature", Proceedings of the National Academy of Sciences, vol. 120, 2023. http://dx.doi.org/10.1073/pnas.2300758120
- D.W.J. Thompson, D.J. Seidel, W.J. Randel, C. Zou, A.H. Butler, C. Mears, A. Osso, C. Long, and R. Lin, "The mystery of recent stratospheric temperature trends", Nature, vol. 491, pp. 692-697, 2012. http://dx.doi.org/10.1038/nature11579
- A.C. Maycock, W.J. Randel, A.K. Steiner, A.Y. Karpechko, J. Christy, R. Saunders, D.W.J. Thompson, C. Zou, A. Chrysanthou, N. Luke Abraham, H. Akiyoshi, A.T. Archibald, N. Butchart, M. Chipperfield, M. Dameris, M. Deushi, S. Dhomse, G. Di Genova, P. Jöckel, D.E. Kinnison, O. Kirner, F. Ladstädter, M. Michou, O. Morgenstern, F. O'Connor, L. Oman, G. Pitari, D.A. Plummer, L.E. Revell, E. Rozanov, A. Stenke, D. Visioni, Y. Yamashita, and G. Zeng, "Revisiting the Mystery of Recent Stratospheric Temperature Trends", Geophysical Research Letters, vol. 45, pp. 9919-9933, 2018. http://dx.doi.org/10.1029/2018gl078035
- C. Zou, H. Qian, W. Wang, L. Wang, and C. Long, "Recalibration and merging of SSU observations for stratospheric temperature trend studies", Journal of Geophysical Research: Atmospheres, vol. 119, pp. 13,180-13,205, 2014. http://dx.doi.org/10.1002/2014JD021603
- M.C. Casas, G.A. Schmidt, R.L. Miller, C. Orbe, K. Tsigaridis, L.S. Nazarenko, S.E. Bauer, and D.T. Shindell, "Understanding Model‐Observation Discrepancies in Satellite Retrievals of Atmospheric Temperature Using GISS ModelE", Journal of Geophysical Research: Atmospheres, vol. 128, 2022. http://dx.doi.org/10.1029/2022JD037523
About Gavin
2 Responses to "CMIP6: Not-so-sudden stratospheric cooling"
Also "SSU mich"
Aber warum wird es in der Stratosphäre immer kälter?
Wie gut schneiden die Modelle ab?
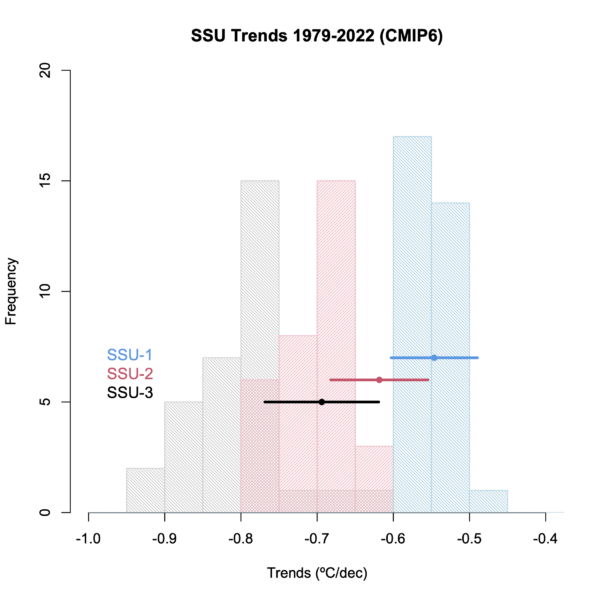
Histogram of CMIP6 model trends for SSU-1, SSU-2 and SSU-3 (counting one per ensemble member). In all cases the observed trends are consistent with the spread of the model ensemble.
Referenzen
- B.D. Santer, S. Po-Chedley, L. Zhao, C. Zou, Q. Fu, S. Solomon, D.W.J. Thompson, C. Mears, and K.E. Taylor, "Exceptional stratospheric contribution to human fingerprints on atmospheric temperature", Proceedings of the National Academy of Sciences, vol. 120, 2023. http://dx.doi.org/10.1073/pnas.2300758120
- D.W.J. Thompson, D.J. Seidel, W.J. Randel, C. Zou, A.H. Butler, C. Mears, A. Osso, C. Long, and R. Lin, "The mystery of recent stratospheric temperature trends", Nature, vol. 491, pp. 692-697, 2012. http://dx.doi.org/10.1038/nature11579
- A.C. Maycock, W.J. Randel, A.K. Steiner, A.Y. Karpechko, J. Christy, R. Saunders, D.W.J. Thompson, C. Zou, A. Chrysanthou, N. Luke Abraham, H. Akiyoshi, A.T. Archibald, N. Butchart, M. Chipperfield, M. Dameris, M. Deushi, S. Dhomse, G. Di Genova, P. Jöckel, D.E. Kinnison, O. Kirner, F. Ladstädter, M. Michou, O. Morgenstern, F. O'Connor, L. Oman, G. Pitari, D.A. Plummer, L.E. Revell, E. Rozanov, A. Stenke, D. Visioni, Y. Yamashita, and G. Zeng, "Revisiting the Mystery of Recent Stratospheric Temperature Trends", Geophysical Research Letters, vol. 45, pp. 9919-9933, 2018. http://dx.doi.org/10.1029/2018gl078035
- C. Zou, H. Qian, W. Wang, L. Wang, and C. Long, "Recalibration and merging of SSU observations for stratospheric temperature trend studies", Journal of Geophysical Research: Atmospheres, vol. 119, pp. 13,180-13,205, 2014. http://dx.doi.org/10.1002/2014JD021603
- M.C. Casas, G.A. Schmidt, R.L. Miller, C. Orbe, K. Tsigaridis, L.S. Nazarenko, S.E. Bauer, and D.T. Shindell, "Understanding Model‐Observation Discrepancies in Satellite Retrievals of Atmospheric Temperature Using GISS ModelE", Journal of Geophysical Research: Atmospheres, vol. 128, 2022. http://dx.doi.org/10.1029/2022JD037523
Gespeichert unter: Climate modelling, Climate Science, Featured Story, Greenhouse gases, Instrumental Record, Sun-earth connections
2 Antworten zu „CMIP6: Nicht ganz so plötzliche Abkühlung der Stratosphäre“
Nigelj sagt
21. Mai 2023 um 19:04 Uhr
Das Google-Konto meines Telefons hat mich vor ein paar Tagen darüber informiert: „Die obere Atmosphäre kühlt ab, was zu neuen Klimaproblemen führt.“ Eine neue Studie, die bekräftigt, dass der globale Klimawandel vom Menschen verursacht wird, ergab außerdem, dass sich die obere Atmosphäre aufgrund des steigenden CO2-Gehalts dramatisch abkühlt. Wissenschaftler sind besorgt über die Auswirkungen, die diese Abkühlung auf umlaufende Satelliten, die Ozonschicht und das Erdwetter haben könnte.“ (Yale-Klimaverbindungen)
https://e360.yale.edu/features/climate-change-upper-atmosphere-cooling#:~:text=A%20new%20study%20reaffirming%20that,ozone%20layer%2C%20and%20Earth's%20weather.
[Antwort: Ich weiß nicht, warum dies neue Klimabedenken hervorrufen würde? Wie ich bereits sagte, wurde dies vor mehr als 50 Jahren vorhergesagt und bereits viele Male bestätigt. Die Auswirkung auf Raumfahrzeuge in niedrigen Erdumlaufbahnen besteht darin, dass die Dichte abnimmt und somit die Reibung geringer ist, sodass davon ausgegangen werden kann, dass Satelliten länger im Orbit bleiben. – Gavin]
Antwort
Nick Palmer sagt
21. Mai 2023 um 23:39 Uhr
Der Artikel von Fred Pearce verwendet einen alten rhetorischen Trick, indem er Dinge wie „Wissenschaftler sind besorgt …“ sagt, was viele vielleicht denken, dass ALLE Wissenschaftler besorgt sind. Ben Santer selbst wird zitiert, er sei „besorgt“ über seine Ergebnisse, aber der Artikel impliziert, dass Santer aufgrund dieser Ergebnisse neue Sorgen hat, die er vorher nicht hatte. Wie Gavin sagt, wird vorhergesagt, dass diese stratosphärischen Effekte 50 Jahre lang auftreten werden
Ich denke, der Ton von Pearces Artikel ist zumindest irreführend und grenzt an Alarmismus – oder zumindest wird er von der leugnenden Fraktion so dargestellt, aber andererseits wird er von alarmistischen Aktivisten eifrig verbreitet
Antwort


My phones google account notified me of this a couple of days ago: “The Upper Atmosphere Is Cooling, Prompting New Climate Concerns. A new study reaffirming that global climate change is human-made also found the upper atmosphere is cooling dramatically because of rising CO2 levels. Scientists are worried about the effect this cooling could have on orbiting satellites, the ozone layer, and Earth’s weather.” (Yale climate connections)
https://e360.yale.edu/features/climate-change-upper-atmosphere-cooling#:~:text=A%20new%20study%20reaffirming%20that,ozone%20layer%2C%20and%20Earth's%20weather.
[Response: I don’t know why this would prompt new climate concerns? As I said this was predicted more than 50 years ago, and has been validated many times before now. The impact on low earth orbit spacecraft is that density is decreasing and so there is less friction and so satellites would be expected to last longer on orbit. – gavin]
Fred Pearce’s article uses an old rhetorical trick by saying things like ‘scientists are worried…’ which many might think implies that ALL scientists are worried. Ben Santer himself is quoted as being ”worried’ by his results but the implication in zhe article is that Santer has new worries from these trsults that he didn’t have before. As Gavin says, these stratospheric effects have been predicted to occur for 50 years
I think the tone of Pearce’s article is at least misleading, verging on alarmist – or at least that is how it will be represented by the denialist faction but, on the other hand, it will be eagerly promulgated by alarmist activists