Samstag, 14. Februar 2026

Snowball Earth’s Liquid Seas Dipped Way Below Freezing - from EOS

 Snowball Earth’s Liquid Seas Dipped Way Below Freezing

Iron isotopes show that salty seawater pockets beneath the ice were as cold as −15°C.
A frozen lake in Antarctica has a blue surface crisscrossed by lines. Behind it is a glacier, a mountain, and a blue sky.
In Antarctic lakes such as Lake Fryxell, fresh water freezes over briny liquid water. New research suggests that the liquid seawater during “snowball Earth” was up to 4 times saltier than modern ocean water, meaning it could reach much lower temperatures before freezing. Credit: Joe Mastroianni, National Science Foundation/Wikimedia Commons

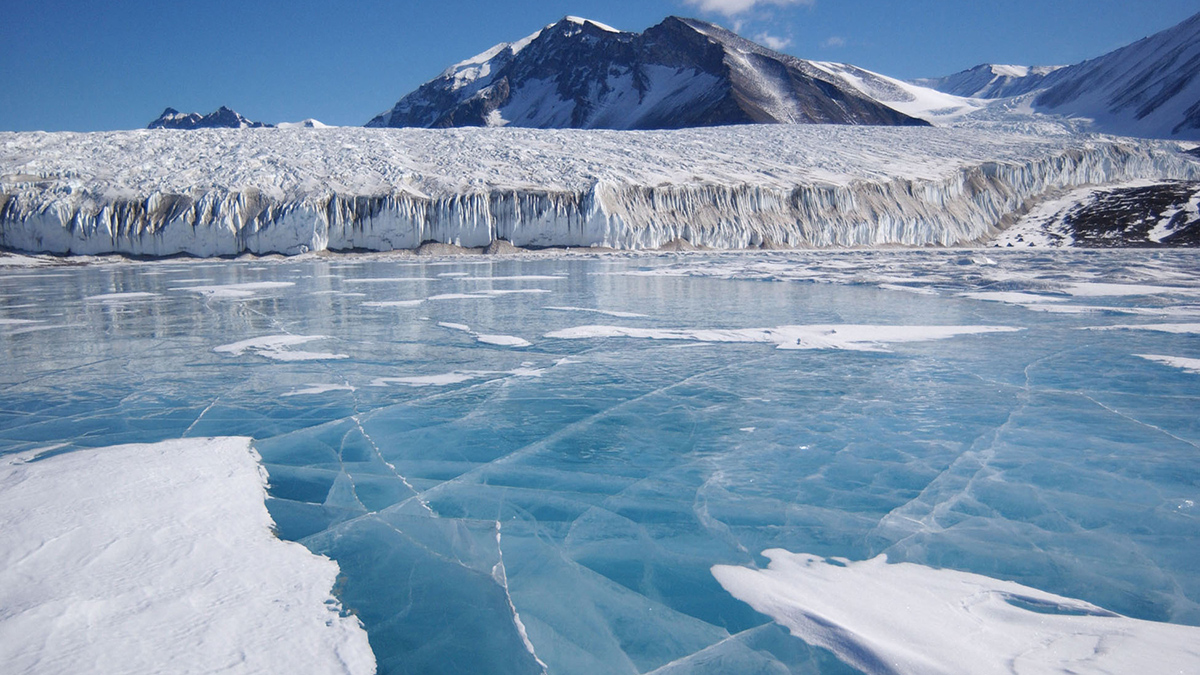
Earth froze over 717 million years ago. Ice crept down from the poles to the equator, and the dark subglacial seas suffocated without sunlight to power photosynthesis. Earth became an unrecognizable, alien world—a “snowball Earth,” where even the water was colder than freezing.

In Nature Communications, researchers reported the first measured sea temperature from a snowball Earth episode: −15°C ± 7°C. If this figure holds up, it will be the coldest measured sea temperature in Earth’s history.

For water to be that cold without freezing, it would have to be very salty. And indeed, the team’s analysis suggests that some pockets of seawater during the Sturtian snowball glaciation, which lasted 57 million years, could have been up to 4 times saltier than modern ocean water.

“We’re dealing with salty brines,” said Ross Mitchell, a geologist at the Institute of Geology and Geophysics of the Chinese Academy of Sciences. “That’s exactly what you see in Antarctica today,” he added, except that snowball Earth’s brines were a bit colder than even the −13°C salty slush of Antarctica’s ice-covered Lake Vida today.

Past Iron

The Sturtian snowball was a runaway climate catastrophe that occurred because ice reflects more sunlight than land or water. Ice reflected sunlight, which cooled the planet, which made more ice, which reflected more sunlight and so on, until the whole world ended up buried under glaciers that could have been up to a kilometer thick.

This unusual time left behind unusual rocks: Rusty red iron formations that accumulated where continental glaciers met the ice-covered seas. To take snowball Earth’s temperature, the team devised a new way to use that iron as a thermometer.

A cross section of a rock, made up of curved, alternating layers of browns and bright orange iron-rich oxides
Scientists used information about the iron in formations like this one to estimate the temperature of Earth’s ocean 717 million years ago. Credit: James St. John/Flickr, CC BY 2.0

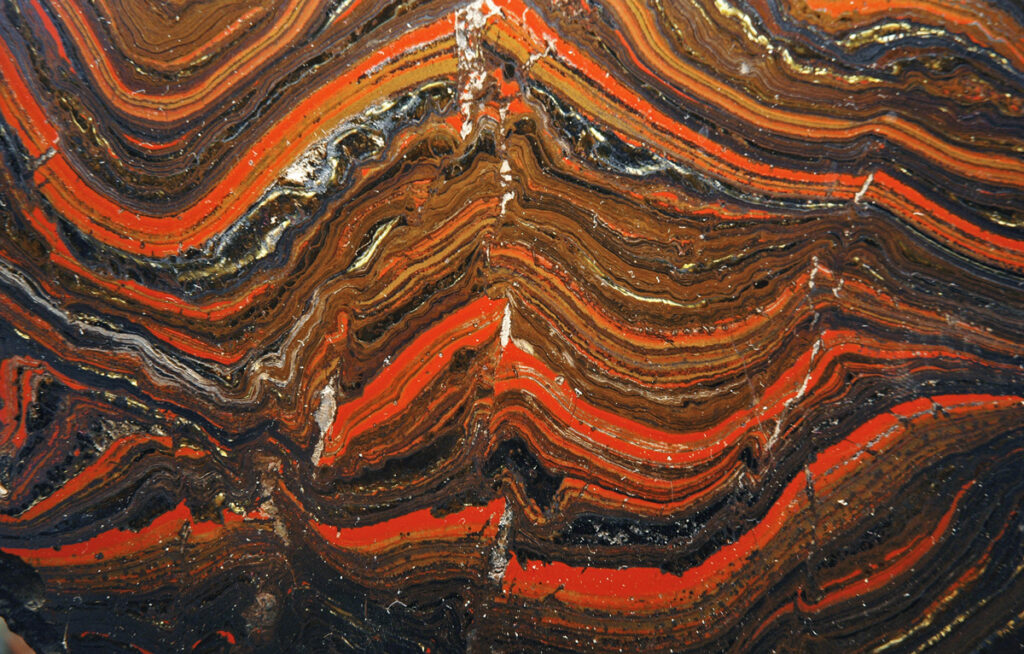
Iron formations accumulate in water that’s rich in dissolved iron. Oxygen transforms the easily dissolved, greenish “ferric” form of iron into rusty red “ferrous” iron that stays solid. That’s why almost all iron formations are ancient, relics of a time before Earth’s atmosphere started filling with oxygen about 2.4 billion years ago, or from the more recent snowball Earth, when the seas were sealed under ice. Unable to soak up oxygen from the air or from photosynthesis, snowball Earth’s dark, ice-covered seawater drained of oxygen.

Iron-56 is the most common iron isotope, but lighter iron-54 rusts more easily. So when iron rusts in the ocean, the remaining dissolved iron is enriched in the heavier isotope. Over many cycles of limited, partial rusting—like what happened on the anoxic Archean Earth—this enrichment grows, which is why ancient iron formations contain isotopically very heavy iron compared to iron minerals that formed after Earth’s atmosphere and oceans filled with oxygen.

Snowball Earth’s iron is heavy, too, even more so than iron formations from the distant, preoxygen past. The researchers realized that temperature could be the explanation: Iron minerals that form in cold water end up istopically heavier. We don’t know exactly how hot it was when the ancient iron formations accumulated, but it was likely warmer than during snowball Earth, when glaciers reached the equator. Using a previous estimate of 25°C for the temperature of Archean seawater, the team calculated that the waters that formed the snowball Earth iron formations would likely have been 40°C colder.

“It’s a very interesting, novel way of getting something different out of iron isotope data,” said geochemist Andy Heard of the Woods Hole Oceanographic Institution, who was not involved in the study. “It’s a funny, backwards situation to be in where you’re using even older rocks as your baseline for understanding something that formed 700 million years ago.”

In part because of that backward situation, Heard thinks the study is best interpreted qualitatively as strong evidence that seawater was really cold, but maybe not that it was exactly −15°C.

The team also analyzed isotopes of strontium and barium to determine that snowball Earth’s seawater was up to 4 times saltier than the modern ocean. Jochen Brocks of the Australian National University, who wasn’t involved in the study, said the researchers’ results align with his own salinity analysis of snowball Earth sediments from Australia based on a different method. Those rocks formed in a brine that Brocks thinks was salty enough to reach −7°C before freezing. Another group reaching a similar conclusion using different methods makes that extreme scenario sound a lot more plausible, he said.

“It was very cool to get the additional confirmation it was actually very, very cold,” he said.

—Elise Cutts (@elisecutts.bsky.social), Science Writer

Citation: Cutts, E. (2026), Snowball Earth’s liquid seas dipped way below freezing, Eos, 107, https://doi.org/10.1029/2026EO260048. Published on 4 February 2026.
Text © 2026. The authors. CC BY-NC-ND 3.0
Except where otherwise noted, images are subject to copyright. Any reuse without express permission from the copyright owner is prohibited.
© 2026 American Geophysical Union. All rights reserved

Mittwoch, 11. Februar 2026

The AMOC of the Ice Age Was Warmer Than Once Thought


An analysis of sediment cores indicates that North Atlantic waters were relatively warm and continued to circulate even under major climate stress during the Last Glacial Maximum.
The back deck of a boat as it moves through the ocean.
Sediment cores collected by instruments such as this one on the back of R/V Neil Armstrong shed light on how the North Atlantic Ocean of the last ice age circulated. Credit: Alice Carter-Champion

A major part of the Atlantic Meridional Overturning Circulation (AMOC), a large-scale ocean circulation pattern, was warmer during the peak of Earth’s last ice age than previously thought, according to a new study published in Nature

The study’s results contrast with those from previous studies hinting that the North Atlantic was relatively cold and that AMOC was weaker when faced with major climate stress during the Last Glacial Maximum (LGM), about 19,000–23,000 years ago. 

The findings add confidence to models that scientists use to project how AMOC may change in the future as the climate warms, said Jack Wharton, a paleoceanographer at University College London and lead author of the new study.

Deepwater Data

The circulation of AMOC, now and in Earth’s past, requires the formation of dense, salty North Atlantic Deep Water (NADW), which brings oxygen to the deep ocean as it sinks and helps to regulate Earth’s climate. Scientists frequently use the climatic conditions of AMOC during the LGM as a test to determine how well climate models—like those used in major global climate assessments—simulate Earth systems. 

However, prior to the new study, few data points existed to validate scientists’ models showing the state of NADW during the LGM. Scientists in 2002 analyzed fluid in ocean bottom sediment cores from four sites in the North Atlantic, South Pacific, and Southern Oceans, with results suggesting that deep waters in all three were homogeneously cold.

A tube of sediment about a yard long, sliced in half lengthwise so the muddy sediment is visible.
Researchers sampled 16 sediment cores from across the North Atlantic to deduce how waters may have circulated during the peak of the last ice age. Credit: Jack Wharton, UCL

“The deep-ocean temperature constraints during the [Last Glacial Maximum] were pretty few and far between,” Wharton said. And to him, the 2002 results were counterintuitive. It seemed more likely, he said, that the North Atlantic during the peak of the last ice age would have remained mobile and that winds and cold air would have cooled and evaporated surface waters, making them saltier, denser, and more prone to create NADW and spur circulation.

“This is quite new,” he remembered thinking. “What kind of good science could help show that this is believable?”

Wharton and his colleagues evaluated 16 sediment cores collected across the North Atlantic. First, they measured the ratio of trace magnesium and calcium in microscopic shells of microorganisms called benthic foraminifera. This ratio relates to the temperature at which the microorganisms lived. The results showed much warmer North Atlantic Deep Water than the 2002 study indicated. 

Wharton felt cautious, especially because magnesium to calcium ratios are sometimes affected by ocean chemistry as well as by temperature: “This is quite new,” he remembered thinking. “What kind of good science could help show that this is believable?”

The team, this time led by Emilia Kozikowska, a doctoral candidate at University College London, verified the initial results using a method called clumped isotope analysis, which measures how carbon isotopes in the cores are bonded together, a proxy for temperature. The team basically “did the whole study again, but using a different method,” Wharton said. The results aligned. 

A grayscale microscopic image of the shell of a microorganism.
Ratios of magnesium to calcium contained in benthic foraminifera, tiny microbes living in marine sediment, offer insights into the temperature of North Atlantic waters thousands of years ago. Credit: Jack Wharton and Mark Stanley

Analyzing multiple temperature proxies in multiple cores from a broad array of locations made the research “a really thorough and well-done study,” said Jean Lynch-Stieglitz, a paleoceanographer at the Georgia Institute of Technology who was not part of the research team but has worked closely with one of its authors. 

The results, in conjunction with previous salinity data from the same cores, allowed the team to deduce how the North Atlantic likely moved during the LGM. “We were able to infer that the circulation was still active,” Wharton said. 

Modeling AMOC

The findings give scientists an additional benchmark with which to test the accuracy of climate models, Lynch-Stieglitz said. “LGM circulation is a good target, and the more that we can refine the benchmarks…that’s a really good thing,” she said. “This is another really nice dataset that can be used to better assess what the Last Glacial Maximum circulation was really doing.”

“Our data [are] helping show that maybe AMOC was sustained.”

In many widely used climate models, North Atlantic circulation during the LGM looks consistent with the view provided by Wharton’s team’s results, indicating that NADW was forming somehow during the LGM, Lynch-Stieglitz said. However, no model can completely explain all of the proxy data related to the LGM’s climatic conditions.

“Our data [are] helping show that maybe AMOC was sustained,” which helps reconcile climate models with proxy data, Wharton said. Lynch-Stieglitz added that a perhaps equally important contribution of the new study is that it removes the sometimes difficult-to-simulate benchmark of very cold NADW during the LGM that was suggested in research in the early 2000s. “We don’t have to make the whole ocean super cold [in models],” she said.

Some climate models suggest that modern-day climate change may slow AMOC, which could trigger a severe cooling of Europe, change global precipitation patterns, and lead to additional Earth system chaos. However, ocean circulation is highly complex, and models differ in their ability to project future changes. Still, “if they could do a great job with LGM AMOC, then we would have a lot more confidence in their ability to project a future AMOC,” Lynch-Stieglitz said.

Wharton said the results also suggest that another question scientists have been investigating about the last ice age—how and why it ended—may be worth revisiting. Many hypotheses rely on North Atlantic waters being very close to freezing during the LGM, he said. “By us suggesting that maybe they weren’t so close to freezing…that sort of necessitates that people might need to rethink the hypotheses.”

—Grace van Deelen (@gvd.bsky.social), Staff Writer

Citation: van Deelen, G. (2026), The AMOC of the ice age was warmer than once thought, Eos, 107, https://doi.org/10.1029/2026EO260053. Published on 10 February 2026.
Text © 2026. AGU. CC BY-NC-ND 3.0
Except where otherwise noted, images are subject to copyright. Any reuse without express permission from the copyright owner is prohibited.

Coastal Wetlands Restoration, Carbon, and the Hidden Role of Groundwater


Coastal wetland restoration offers major carbon benefits, and understanding groundwater processes helps explain how these ecosystems store carbon over the long term.
Two scientists collecting samples in a wetland.
Associate Professor Martin Andersen (UNSW, Sydney) and Dr. Mahmood Sadat-Noori (JCU) collecting samples to measure dissolved greenhouse gases (CO and CH4) in groundwater at Tomago Wetlands, NSW, Australia. Credit: Kate Waddington (UNSW, Sydney)
Editors’ Vox is a blog from AGU’s Publications Department.

Coastal (tidal) wetlands are low-lying ecosystems found where land meets the sea, including mangroves, saltmarshes, and seagrass meadows. They are shaped by tides and support a mix of marine and terrestrial processes. However, agricultural and urban development over the past century have drained, modified, or degraded many of these coastal wetland ecosystems and now require restoration efforts.

A new article in Reviews of Geophysics explores how subsurface hydrology and biogeochemical processes influence carbon dynamics in coastal wetlands, with a particular focus on restoration. Here, we asked the lead author to give an overview of why coastal wetlands matter, how restoration techniques are being implemented, and where key opportunities lie for future research.

Why are coastal wetlands important?

Coastal wetlands provide many benefits to both nature and people. They protect shorelines from storms and erosion, support fisheries and biodiversity, improve water quality by filtering nutrients and pollutants, and store large amounts of carbon in their soils. Despite covering a relatively small area globally, they punch well above their weight in terms of ecosystem services, making them critical environments for climate regulation, coastal protection, and food security.

What role do coastal wetlands play in the global carbon cycle?

Coastal wetlands are among the most effective natural systems for capturing and storing carbon.

Coastal wetlands are among the most effective natural systems for capturing and storing carbon. This stored carbon is often referred to as “blue carbon”. Vegetation in these ecosystems, such as mangroves, saltmarsh, and seagrass, take up carbon dioxide from the atmosphere through photosynthesis and transfer it to sediments through roots. These plants can store carbon 40 times faster than terrestrial forests. Because coastal wetland sediments are often waterlogged and low in oxygen, this carbon can be stored for centuries to millennia. In addition to surface processes, groundwater plays an important but less visible role by transporting dissolved carbon into and out of wetlands. Understanding these hidden subsurface pathways is essential for accurately estimating how much carbon wetlands store and how they respond to environmental change.

How has land use impacted coastal wetlands over the past century?

Over the past century, coastal wetlands have been extensively altered or lost due to human activities. Large areas have been drained, filled, or isolated from tides to support agriculture, urban development, ports, and flood protection infrastructure. These changes disrupt natural water flow, reduce plant productivity, and expose carbon-rich soils to oxygen, which can release stored carbon back into the atmosphere as greenhouse gases. In many regions, groundwater flow paths have also been modified by drainage systems and groundwater extraction, further altering wetland function. As a result, many coastal wetlands have shifted from long-term carbon sinks to sources of emissions.

How could restoring wetlands help to combat climate change?

Restoring coastal wetlands can help combat climate change by re-establishing natural processes that promote long-term carbon storage.

Restoring coastal wetlands can help combat climate change by re-establishing natural processes that promote long-term carbon storage. When tidal flow and natural hydrology are restored, wetland plants can recover, sediment accumulation increases, and carbon burial resumes. Importantly, restoration can also reconnect groundwater and surface water systems, helping stabilize (redox) conditions that favor carbon preservation in sediments. While wetlands alone cannot solve climate change, they offer a powerful nature-based solution that delivers climate mitigation alongside co-benefits such as coastal protection, biodiversity recovery, and improved water quality. Getting restoration right is key to ensuring these systems act as carbon sinks rather than sources.

What are the main strategies being deployed to restore coastal wetlands?

Common restoration strategies include removing or modifying levees and tidal barriers, reconnecting wetlands to natural tidal regimes, re-establishing natural vegetation through improving the hydrology of the site, and managing sediment supply. Increasingly, restoration projects are recognizing the importance of subsurface processes, such as groundwater flow and salinity dynamics, which strongly influence vegetation health and carbon cycling. Successful restoration requires site-specific designs that consider hydrology, geomorphology, and long-term sea-level rise.

What are some remaining questions where additional research efforts are needed?

Despite growing interest in wetland restoration, major knowledge gaps remain. One key challenge is quantifying how groundwater processes influence carbon storage and greenhouse gas emissions across different wetland types and climates. We also need better long-term measurements to assess whether restored wetlands truly deliver sustained carbon benefits under rising sea levels and increasing climate variability. Finally, integrating hydrology, biogeochemistry, and ecology into predictive models remains difficult but essential. Addressing these gaps will improve carbon accounting, guide smarter restoration investments, and strengthen the role of coastal wetlands in climate mitigation strategies.

—Mahmood Sadat-Noori (mahmood.sadatnoori@jcu.edu.au; 0000-0002-6253-5874), James Cook University: Townsville, Australia

Editor’s Note: It is the policy of AGU Publications to invite the authors of articles published in Reviews of Geophysics to write a summary for Eos Editors’ Vox.

The logo for the United Nations Sustainable Development Goal 15 is at left. To its right is the following text: The research reported here supports Sustainable Development Goal 15. AGU is committed to supporting the United Nations 2030 Agenda for Sustainable Development, which provides a shared blueprint for peace and prosperity for people and the planet, now and into the future.
Citation: Sadat-Noori, M. (2026), Coastal wetlands restoration, carbon, and the hidden role of groundwater, Eos, 107, https://doi.org/10.1029/2026EO265003. Published on 9 February 2026.
This article does not represent the opinion of AGU, Eos, or any of its affiliates. It is solely the opinion of the author(s).
Text © 2026. The authors. CC BY-NC-ND 3.0
Except where otherwise noted, images are subject to copyright. Any reuse without express permission from the copyright owner is prohibited.

Freitag, 9. Januar 2026

Neue Ergebnisse zu AMOC(Atlantik-Strömung)-Simulationen

 https://eos.org/research-spotlights/what-could-happen-to-the-oceans-carbon-if-amoc-collapses


Was könnte mit dem Kohlenstoff des Ozeans passieren, wenn AMOC zusammenbricht

Das Schmelzen des Massengletschers könnte dazu geführt haben, dass dieses einflussreiche Meeresströmungssystem am Ende der letzten Eiszeit zusammenbrach. Ein Paar von Modellierungsstudien untersucht, wie ein solcher Kollaps gelöste anorganische Kohlenstoff- und Kohlenstoffisotope in den Ozeanen der Erde beeinflussen könnte.
Ein koloriertes Bild des Nordatlantiks zeigt Wirbel von (von oben nach unten) blau, grün, gelb und orange.
Die Atlantic Meridional Overturning Circulation (AMOC) ist das System von Strömungen, die für das Herunterfahren von warmem Wasser nach Norden und kälterem, dichterem Wasser nach Süden verantwortlich sind. Hier zu sehen ist eine modellierte Ansicht von Oberflächenströmen und Wirbeln im Nordatlantik. Quelle: Goddard Space Flight Center der NASA
Quelle: Globale Biogeochemische Zyklen

Die Atlantic Meridional Overturning Circulation (AMOC) ist das System von Strömungen, die für das Herunterfahren von warmem Wasser nach Norden und kälterem, dichterem Wasser nach Süden verantwortlich sind. Dieser „Förderband“-Prozess hilft, Wärme, Nährstoffe und Kohlenstoff auf dem Planeten umzuverteilen.

Während der letzten Eiszeit, die vor etwa 120.000 bis 11.500 Jahren stattfand, korrelierten Millennial-Skalen-Störungen bei AMOC mit Temperaturverschiebungen, atmosphärischem 2Kohlendioxid (CO 2) und Kohlenstoffkreislauf im Ozean - sowie Veränderungen in den Signaturen von Kohlenstoffisotopen sowohl in der Atmosphäre als auch im Ozean. Am Ende der letzten Eiszeit führte ein Massenschmelzen der Gletscher dazu, dass ein Zustrom von kaltem Schmelzwasser den nördlichen Atlantik überschwemmte, was dazu geführt haben könnte, dass AMOC geschwächt oder vollständig zusammenbrach.

Heute, wenn sich das Klima erwärmt, könnte sich AMOC wieder abschwächen. Die Zusammenhänge zwischen AMOC, Kohlenstoffgehalt und isotopischen Variationen sind jedoch noch nicht gut verstanden. Neue Modellierungsbemühungen in einem Paar von Studien von Schmittner und Schmittner und Boling simulieren einen AMOC-Kollaps, um zu erfahren, wie sich die Speicherung von Ozeankohlenstoff, Isotopensignaturen und der Kohlenstoffkreislauf während dieses Prozesses ändern könnten.

Beide Studien verwendeten die Version der Oregon State University des Klimamodells der University of Victoria (OSU-UVic), um Kohlenstoffquellen und Transformationen im Ozean und in der Atmosphäre unter Gletscher- und vorindustriellen Zuständen zu simulieren. Dann wandten die Forscher eine neue Methode auf die Simulation an, die die Ergebnisse genauer aufschlüsselt. Es trennt gelöste anorganische Kohlenstoffisotope in vorgeformte versus regenerierte Komponenten. Darüber hinaus unterscheidet es isotopische Veränderungen, die aus physikalischen Quellen wie Ozeanzirkulation und Temperatur stammen, von denen, die aus biologischen Quellen stammen, wie der Plankton-Photosynthese.

Die Ergebnisse beider Modellsimulationen deuten darauf hin, dass ein AMOC-Kollaps Kohlenstoff in den Ozeanen sowie in der Atmosphäre und an Land umverteilen würde.

In der ersten Studie, in den ersten mehreren hundert Jahren der Modellsimulation, nahmen die atmosphärischen Kohlenstoffisotope zu. Um das Jahr 500 fielen sie stark, wobei Ozeanprozesse den anfänglichen Anstieg und Landkohlenstoff den Rückgang steuerten. Der Rückgang ist im Nordatlantik sowohl in eiszeitlichen als auch in vorindustriellen Szenarien besonders ausgeprägt und wird durch remineralisierte organische Materie und vorgeformte Kohlenstoffisotope angetrieben. Im Pazifik, im Indischen und im Südlichen Ozean gab es einen kleinen Anstieg der Kohlenstoffisotope.

In der zweiten Studie zeigte die Modellleistung, dass der gelöste anorganische Kohlenstoff zunahm und dann abnahm, was zu den inversen Veränderungen in der atmosphärischen CO 22 führte. In den ersten tausend Jahren der Modellsimulation kann dieser Anstieg des gelösten anorganischen Kohlenstoffs teilweise durch die Ansammlung von atemberaubtem Kohlenstoff im Atlantik erklärt werden. Der anschließende Rückgang bis zum Jahr 4.000 wird in erster Linie durch eine Abnahme des vorgeformten Kohlenstoffs in anderen Ozeanbecken verursacht. (Global Biogeochemical Cycles, https://doi.org/10.1029/2025GB008527 und https://doi.org/10.1029/2025GB008526, 2025).

—Rebecca Owen (@beccapox.bsky.social), Science Writer


Zitat: Owen, R. (2026), Was könnte mit dem Kohlenstoff des Ozeans passieren, wenn AMOC zusammenbricht, Eos, 107, https://doi.org/10.1029/2026EO260016. Veröffentlicht am 6. Januar 2026.
Text © 2026. AGU. CC BY-NC-ND 3.0
Sofern nicht anders angegeben, unterliegen Bilder dem Urheberrecht. Jede Wiederverwendung ohne ausdrückliche Genehmigung des Urheberrechtsinhabers ist untersagt.

Donnerstag, 30. Oktober 2025

Plastic agreement in Crisis


  • EDITORIAL

Trust and science: the essential elements missing from plastics treaty talks

Dirty plastic bottle floating on a oil-stained water surface.

Plastics overwhelmingly end up in the ocean or at landfill sites.Credit: Salvatore Laporta/KONTROLAB/LightRocket/Getty

In August, the world should have been celebrating the first global agreement to end plastics pollution. Instead, negotiators from more than 180 countries ended the latest round of talks in Geneva, Switzerlandamid acrimony. And, as if that wasn’t bad enough, the chair of the talks, Luis Vayas Valdivieso, a diplomat from Ecuador, has resigned.

The chair and the United Nations Environment Programme (UNEP), which organizes the talks, have failed to bridge the gulf between countries that want chemicals of concern to be regulated and plastics production to be decarbonized over time, and those who would prefer an agreement that focuses on a narrower range of measures, such as improved recycling. But this crisis can both be resolved and be prevented from happening again, suggest the authors of two articles in this week’s issue.

Plastics production and consumption cause growing — and in some ways existential — risks for people and ecosystems. More than 400 million tonnes of the material are produced annually, a number that has been rising sharply. Only around one-tenth of plastics are recycled; the rest winds up mostly at landfill sites or in the ocean. If current trends continue, plastics will be responsible for 15% of greenhouse-gas emissions by 2050. Moreover, an expanding body of knowledge is drawing attention to the health impacts that these products have (M. H. Lamoree et al. Nature Med. 31, 2873–2887; 2025).

This is why the international community began talks on ending plastics pollution three years ago. Despite five rounds so far, an agreement that all parties can abide by has remained elusive. The next chair and UNEP must now collaborate with member states to achieve this task.

Maria Ivanova, a social scientist at Northeastern University in Boston, Massachusetts, proposes that, to move forwards, negotiators must look back. The modern era of multilateral environmental agreements followed the landmark 1972 UN Conference on the Human Environment in Stockholm, the first time that heads of government were involved in such an event. Scholars have spent the subsequent five decades studying how this and other accords came to pass, the difficulties of implementing them and how states can do better.

Social scientist Rakhyun Kim at Utrecht University in the Netherlands and conservation scientist Peter Bridgewater at the University of Canberra propose that governments should use research tools to evaluate whether treaties are achieving their aims. “Scientists need an independent expert body, mandated by governments, to produce authoritative and binding recommendations for environmental bodies and treaties,” they write.

Ivanova studies the role of UNEP, which was created as a result of the Stockholm conference. A core problem with the plastics treaty, she notes, is that the talks have become mired in a ‘villains versus heroes’ narrative, obscuring a complex reality. Currently, nations’ disparate views are amplified through lobbying, influencing media reports. This then further polarizes discussions.

Science and diplomacy

Moreover, there is currently no mechanism for sharing reliable scientific information on plastics. Scientists can attend the talks as observers, and as members of official delegations. However, research is not currently used to formally inform the documents that are part of the talks.

UNEP, Ivanova writes, needs to “revive its role as an impartial steward for conveying reliable scientific data, and for creating structures and spaces in which states can seek alignment”, a part that it has played with notable success before. In 1988, UNEP was one of the two co-founders (along with the World Meteorological Organization) of the Intergovernmental Panel on Climate Change (IPCC). Since then, IPCC reports have helped to educate climate-treaty negotiators and establish a shared body of knowledge that has informed legally binding accords to reduce greenhouse-gas emissions, such as the 1997 Kyoto Protocol and the 2015 Paris agreement. Those accords took too long to be agreed on, and, as Kim and Bridgewater also note, there has been much backsliding in their implementation. However, the agreements, imperfect as they are, would probably not have been reached without the formal involvement of researchers.

The absence of an expert panel to inform the plastics negotiations is about to be remedied with the establishment of the Intergovernmental Science-Policy Panel on Chemicals, Waste and Pollution, which will have its first meeting in Geneva next February. The panel’s researchers must, as a priority, be asked to establish a consensus on the available data for issues related to the talks.

Equally important, as Ivanova says, is the need to expand informal diplomatic spaces, where negotiators who hold what might seem irreconcilable positions can meet and get to know each other as people, not just as representatives of their country’s official position.

B&W photo of a middle age man riding a bike with other people behind him cycling.

Maurice Strong, secretary-general of the 1972 United Nations conference on the human environment, cycles through Stockholm.Credit: SCANPIX SWEDEN/AFP/Getty

The literature on the benefits of such an approach to treaty-making goes back a long way. Canada’s Maurice Strong, the secretary general of the 1972 Stockholm conference, had to navigate a divide that was wider than the current one. Back then, delegates from poorer countries, many of which had gained independence from colonial rule, were threatening to skip the conference. Some considered the idea of protecting the environment a new form of colonization, says Boston University environmental scientist Adil Najam, who studies the involvement of low- and middle-income countries (LMICs) in international environmental agreements (A. Najam Int. Environ. Agreements 5, 303–321; 2005). The representatives argued that, like richer countries, their nations should be allowed to industrialize before going green.

Strong and his team understood that they couldn’t make progress without engaging with these concerns. Before the official talks, he worked with a group of researchers to organize a more informal meeting in Founex, Switzerland. One aim was for all sides to discuss environmental protection from the LMICs’ perspective in both a less formal and a less adversarial setting. That meeting went a long way in persuading LMIC delegates to participate in the official talks, Najam says.

For the plastics treaty talks to succeed, the incoming chair, hosts and delegates need to up their game. There is still time to find a way to include science and improve the overall mood of the talks. Everyone must have access to the best available knowledge, and the space to have honest conversations in an atmosphere of trust.

Nature 646, 1025-1026 (2025)

doi: https://doi.org/10.1038/d41586-025-03469-8

Snowball Earth’s Liquid Seas Dipped Way Below Freezing - from EOS

  Snowball Earth’s Liquid Seas Dipped Way Below Freezing Iron isotopes show that salty seawater pockets beneath the ice were as ...